3 Graphs That Show What's Going On In China's Housing Market Right Now
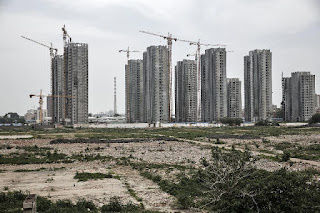
Residential buildings stand under construction in Jining, China on Monday, May 30, 2016. Photographer: Qilai Shen/Bloomberg The “China property bubble” has come back to a headline-making theme but a quick look at the data uncovers a more nuanced picture, and how this time might be a bit different. The chart above illustrates the cyclicality of the housing markets, with an almost sinusoidal line that represents a monthly year-on-year growth in average house price index for 100 cities.


