3 Graphs That Show What's Going On In China's Housing Market Right Now
 |
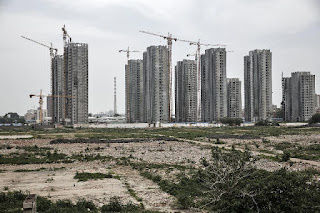
| Residential buildings stand under construction in Jining, China on Monday, May 30, 2016. Photographer: Qilai Shen/Bloomberg |
The chart above illustrates the cyclicality of the housing markets, with an almost sinusoidal line that represents a monthly year-on-year growth in average house price index for 100 cities.
The high-level storyline is this: policy easing in 2014-2015 led to a sharp rebound in house prices in 2016 and in recent months house prices escalated to record levels at a record pace. It led policy makers to impose waves of home purchase and credit restrictions, especially in the beginning of October, and it is still too early to judge what impact these measures will have.
The 2016 price spike has defied many, if not all, expectations. How bubbly is the market really now and how is this time different?
1. Only some cities have shown signs of “bubble trouble” but they weigh heavily on overall view.
First, of 100 or so major cities, only several recorded historic unusually fast price growth (upper part of the chart below), and even fewer saw such price growth combined with strong volume growth (top-right quadrant on the chart below). Median price growth for the 100 cities in August year-on-year was still only around +2%, as many cities continue to see year-on-year price growth in a negative territory.
While Tier-1 cities have done well on the same metrics, especially Shenzhen (though now with declining volumes – see top-left of the chart above), it is some lower-tier cities that have experienced the strongest price growth. That’s thanks to the spillover effects from the neighboring Tier-1 cities, such as the cases of Huizhou and Dongguan near Shenzhen. Absolute price levels (price indices) help explain this dynamic – Shenzhen prices stood at around 54,000 RMB/sqm compared to nearby Huizhou at 9,000 RMB/sqm or Dongguan at RMB 13,000/sqm, as of August 2016.
If you have read somewhere about China and how “Tier-1 cities do very well, but lower-tier cities are in trouble,” then the chart and points above suggest the reality may be more nuanced for a number of lower-tier cities. On the other hand, the majority of the lower-tier cities do not enjoy such pronounced spillover effects.
3. Inventory is low in the outperforming Tier-2 cities.
Prices rose sharply in select Tier-2 cities such as Nanjing and Hefei, cities that enjoy relatively low inventory and fast pace of inventory clearing, and strong fundamental demand. Not surprisingly, these cities have been the targets of the waves of home purchase and credit restrictions, along with the Tier-1 cities.
4. Overall land sales remain low, unlike in the 2013 up-cycle.
I wrote a post back in January this year, How Oversupplied Is China Property Market Really, pointing at very low land sales levels that would result in less future supply. August data still shows the land sales have not picked up and that’s what makes this cycle very different from the previous run-up in prices in 2013 (see chart below) when land sales picked up significantly as the prices and volumes were on the upswing.
There are other more fundamental factors: lower mortgage costs and fast-rising mortgage debt, investment switch from stocks to property for speculators (after the mid-2015 stock market crash), continued lack of investment alternatives, and the perception of buying homes as a store of value, and lack of property taxes.
However, in terms of policy-driven cyclicality, the current point in the market cycle is quite analogous to the Q4 2013 (gradually intensifying tightening measures in response to bubble concerns) except for the lower land sales. Whether and how soon we will see the impact of the home purchase restrictions is still not clear after latest early-October tightening. The varying performance of cities suggest the policy impact will also vary and the effects on prices will be preceded by the sales volumes decline and likely come with some lag, like in the 2013-2014 cycle.
Sourced- Forbes


Comments
Post a Comment
Disclaimer: Opinions expressed in comments are those of the comment writers alone and does not reflect or represent the views of ChangeAgent Property